2. Home
Home page is the first screen you will see when you login into Motadata. The home page has rich set of widgets that gives you an eagle eye view of your complete IT infrastructure.
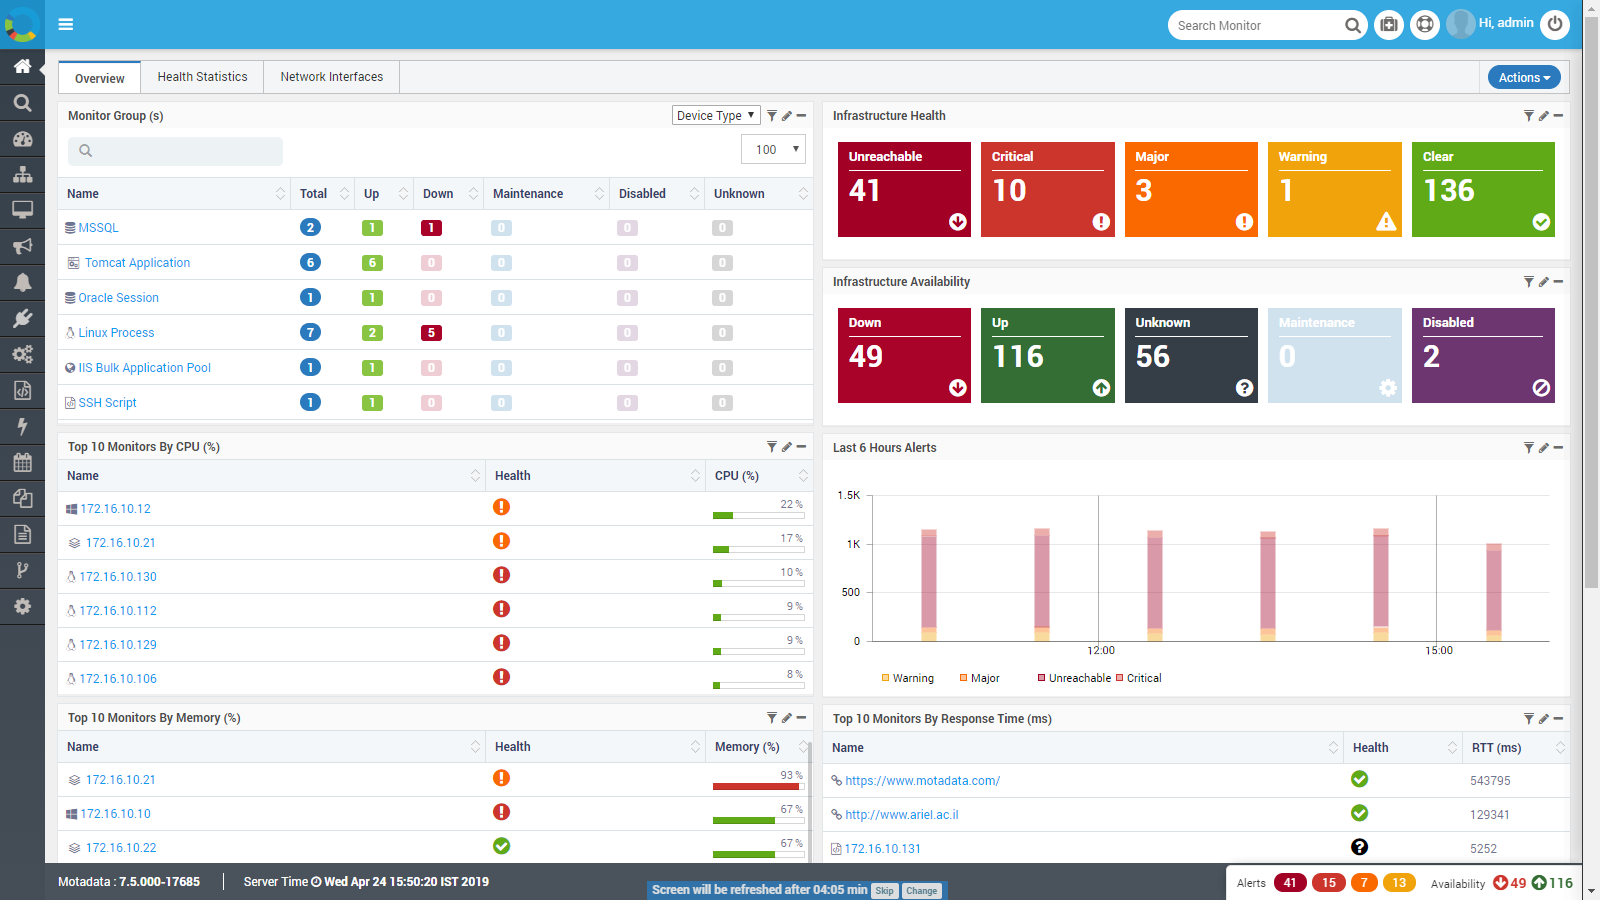
Home Page
The home page contains:
Header Bar: Header bar is available at the top of Motadata application. The bar is accessible from all the pages of application. The header bar mainly hosts the name of the logo and icon of Motadata. Also, the header bar has some of the very important features, so you can access them quickly. From the header you can:
Search IP, monitors, tags etc.
Analyze the health of Motadata
Get support from our dedicated support team
View and manage the information associated with user.
Overview Tab: Login into Motadata and you’ll see different widgets showing the overview of your network. The ‘Overview’ tab has 9 widgets designed to show the latest alerts and top 10 performances of monitors in different categories.
Health Statistics Tab: This tab gives an overview of the IT infrastructure monitored by Motadata on the basis of tags. Your smart use the tags with the monitors will help you easily check the health of your favorite/important monitors.
Network Interfaces Tab: This tab gives an overview of the IT infrastructure in terms of the network traffic and interfaces. You can monitor and analyze the comprehensive traffic, performance, and network interfaces in your network.